News
Method for Analyzing Single-Cell Data Identifies AML Stem Cells

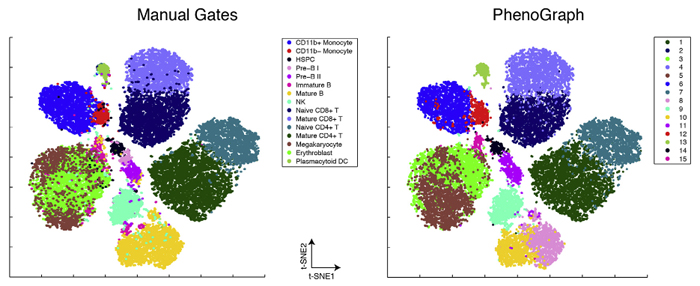
PhenoGraph, a new algorithm developed in Dana Pe'er's laboratory, proved capable of accurately identifying AML stem cells, reducing high-dimensional single cell mass cytometry data to an interpretable two-dimensional graph. Image courtesy of Dana Pe'er.
A key problem that has emerged from recent cancer research has been how to deal with the enormous heterogeneity found among the millions of cells that make up an individual tumor. Scientists now know that not all tumor cells are the same, even within an individual, and that these cells diversify into subpopulations, each of which has unique properties, or phenotypes. Of particular interest are cancer stem cells, which are typically resistant to existing cancer therapies and lead to relapse and recurrence of cancer following treatment. Finding better ways to distinguish and characterize cancer stem cells from other subpopulations of cancer cells has therefore become an important goal, for once these cells are identified, their vulnerabilities could be studied with the aim of developing better, long lasting cancer therapies.
In a paper just published online in Cell, investigators in the laboratories of Columbia University’s Dana Pe’er and Stanford University’s Garry Nolan describe a new method that takes an important step toward addressing this challenge. As Dr. Pe’er explains, “Biology has come to a point where we suddenly realize there are many more cell types than we ever imagined possible. In this paper, we have created an algorithm that can very robustly identify such subpopulations in a completely automatic and unsupervised way, based purely on high-dimensional single-cell data. This new method makes it possible to discover many new cell subpopulations that we have never seen before.”
Using an experimental technology called mass cytometry alongside a new computational algorithm, PhenoGraph, for analyzing the resulting data, Nolan and Pe’er classified millions of individual blast cells responsible for acute myelogenous leukemia (AML) into subpopulations with distinct phenotypes. Their method revealed a pattern of cell signaling that was indicative of a primitive cell state that could distinguish AML-driving cancer stem cells. It also enabled the discovery of a gene expression signature that was predictive of patient survival. Moreover, the method described in the paper is not only applicable to AML, but could be applied to studies of other cancers or tissues, offering a general strategy for identifying subpopulations of cells that share distinctive phenotypes.
Social networks and cellular "communities"
AML is an aggressive liquid tumor that arises in bone marrow when normal myeloid cell development becomes disrupted, leading to the proliferation of cancerous blast cells that overwhelm the ordinary function of the system that makes blood. Scientists have previously shown that the disease is initiated by leukemic stem cells, and thus being able to characterize and target them could offer a strategy for fighting the disease. However, previous research that has sought to define AML stem cells by the presence of specific proteins on their surface — the typical approach for classifying healthy immune cells — has not found a reliable and consistent way to identify AML stem cells.
The authors sought to address this problem using mass cytometry, a technology that can measure the expression and activity of up to 40 different proteins in massive numbers of single cells, one cell at a time. In this case, they looked at 15 million cells from 21 individuals — including patients with and without AML — measuring 31 proteins following exposure to one of 17 different conditions.
Importantly, the protein markers the investigators chose to monitor included cell surface proteins as well as specific markers inside the cell that are involved in key signaling pathways. Particularly because it is clear that the disease arises when internal programs that control myeloid cell development go awry, the authors hypothesized that looking at these pathways could better discriminate the cells’ phenotypes than surface proteins.
Mass cytometry offers a wealth of information for studying single cells, but also presents a difficult analytical challenge. In this case, the result of the experiment was a high-dimensional dataset made up of 500 million molecular measurements that would be extremely difficult to interpret using existing computational methods. To extract useful insights from this enormous number of observations, investigators in the Pe’er Lab developed PhenoGraph, a new algorithm that uses advanced mathematical concepts to reduce the high-dimensional data into an interpretable graph. In this case, the result was a 15 million node graph, with each node representing one individual cell.

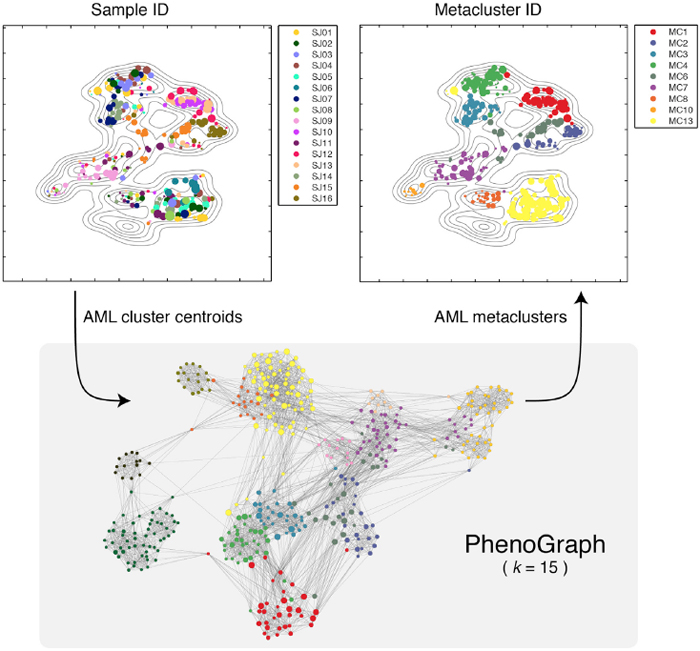
PhenoGraph defines major AML phenotypes by building metaclusters based on its partitions of subpopulations of cells in individual patients. Image courtesy of Dana Pe'er.
In this graph, each cell is connected to the cells that are most similar to it, thus creating a “social network” of cells, where similar cells accumulate in highly connected components of the graph called “communities.” It then borrows methods initially developed to identify communities in online social networks as a way of distinguishing clusters of cells based on their phenotypic similarity. Similar to how Facebook or LinkedIn can infer communities of users based on their online connections and behaviors, the communities into which PhenoGraph decomposes cells constitute subpopulations that have the most similar high-dimensional measurements and are therefore most likely to share similar phenotypic behaviors. Using a second application of the same algorithm, this time looking for consistency in clusters across multiple patients, it then looks for “metaclusters” that represent major phenotypes present in AML.
When they applied this approach to AML, PhenoGraph assigned the collection of millions of cells into just 14 metaclusters that appeared repeatedly among the patients they studied. Each patient’s tumor could then be described as a combination of phenotypes selected from these 14 metaclusters. The authors found that each metacluster occurred in multiple patients, suggesting that although each individual patient’s leukemia is genetically unique, AML has a limited number of phenotypic states it can assume. Understanding these phenotypic states in more detail could therefore focus future researchers’ attention on strategies most likely to be effective in diagnosing and treating the disease.
Signaling properties provide a signature of the AML stem cell
The new paper also addresses a key question that has long troubled the AML research community. For years, scientists have debated which surface proteins might identify leukemic stem cells. Solving this question is important because AML is driven by the accumulation of these developmentally immature cells. Some have suggested that a marker called CD34 might define the AML tumor stem cell, although a large, competing body of evidence argues against using CD34 as a distinguishing feature. The Pe’er Lab considered this question by comparing how well the presence of specific surface proteins on the cells they studied predicted patient survival, as opposed to predictions based on signaling properties.
To do so, the researchers developed an additional method called Statistical Analysis of Perturbation Response (SARA), which examines changes in intracellular signaling under different conditions. When they looked at healthy immune cells, they found that changes in surface and signaling phenotypes are closely correlated when the cells are exposed to changes in their environment, suggesting that surface markers may indeed be useful proxies for their phenotypic identities. In cancer, however, they found something quite different — surface markers and signaling activity became largely decoupled, with no consistent correlation between the two. This is likely due to genetic and epigenetic changes that arise inside cells when they turn cancerous.

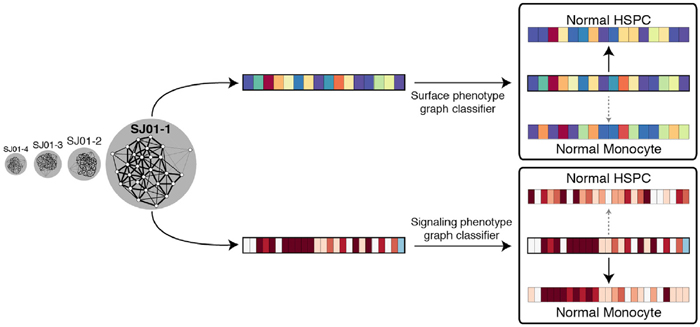
The authors classified each AML subpopulation to determine its similarity to primitive hematopoietic stem progenitor cells, using both surface phenotype and signaling phenotype. Image courtesy of Dana Pe'er.
In every case of AML, the authors also found an AML cell subpopulation that retained a specific signaling program found in primitive, undifferentiated hematopoietic stem progenitor cells. At the same time, this population differed in its surface marker profile across different patients, again suggesting that surface proteins are not effective markers for cancer cell phenotypes.
In addition, using gene expression data matched to these patients, the investigators identified a gene expression signature that correlated with the fraction of cells that exhibit this primitive signaling program. They then demonstrated that this expression signature is significantly predictive of survival in two independent patient cohorts.
This combination of findings, the authors argue, for the first time reveals a consistent signature that can finally define and identify the elusive AML stem cell. The authors anticipate that additional investigation of this signaling-based definition of AML stem cells could also lead to future discoveries regarding vulnerabilities in these cells that could be targeted therapeutically.
Single-cell techniques offer new opportunities
Discussing the potential impact of this new single-cell approach, Pe’er points out, “Many of the cellular populations we identified in this study are novel. They haven’t been seen before because instead of just looking for known surface marker combinations you need to go to the higher dimensionality that mass cytometry offers and search for novel subpopulations in an unsupervised manner. PhenoGraph gives us a very powerful algorithm that allows us to take a population – whether it be a tumor or a novel type of tissue – and in a computational way break it down into very robust cell types.”
In future work, she anticipates, PhenoGraph could not only offer a strategy for generating more precise knowledge about the heterogeneity found in cancer, but also enable the development of an atlas of all cell types found in the human body.
— Chris Williams