News
Distinguishing Patterns of Tumor Evolution in Chronic Lymphocytic Leukemia
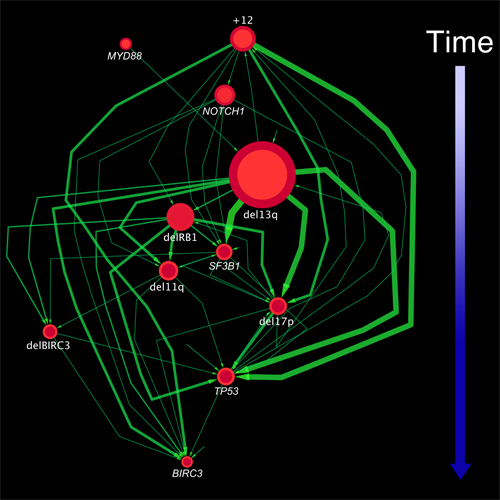
 A graph representing the sequence of genomic alterations in chronic lymphocytic leukemia (CLL). Each node represents a mutation, with arrows indicating temporal relationships between them. The size of the nodes indicates the number of patients in the study who exhibited the alteration, while the thickness of the lines shows how often the temporal relationships between nodes were seen. The method the researchers use enabled them to identify multiple, distinct evolutionary patterns in CLL.
As biologists have gained a better understanding of cancer, it has become clear that tumors are often driven not by a single mutation, but by a series of genetic changes that correspond to particular stages of cancer progression. In this sense, a tumor is constantly evolving, with different groups of cells that harbor distinctive mutations multiplying at different rates, depending on their fitness for particular disease states. As the search for more effective cancer diagnostics and therapies continues, one key question is how to disentangle the order in which mutations occur in order to understand how tumors change over time. Being able to predict how a tumor will behave based on signs seen early in the course of disease could enable the development of new diagnostics that could better inform treatment planning.
In a paper just published in the journal eLife, a team of investigators led by Department of Systems Biology Associate Professor Raul Rabadan reports on a new computational strategy for addressing this challenge. Their framework, called tumor evolutionary directed graphs (TEDG), considers next-generation sequencing data from tumor samples from a large number of patients. Using TEDG to analyze cancer cells in patients with chronic lymphocytic leukemia (CLL), they were able to develop a model of how the disease’s mutational landscape changes from its initial onset to its late stages. Their findings suggest that CLL may not be just the result of a single evolutionary path, but can evolve in alternative ways.
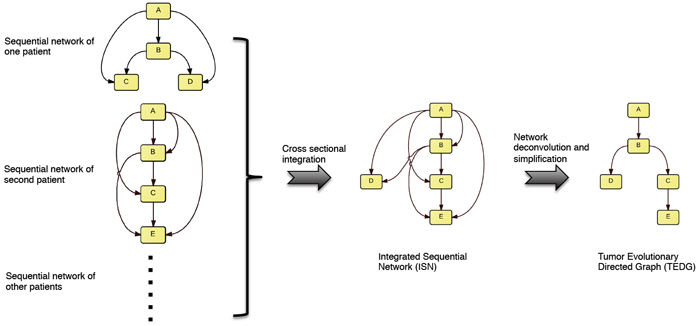
The design of the approach was led by postdoctoral research scientist Jiguang Wang and associate research scientist Hossein Khiabanian, both members of the Rabadan Lab. Their method integrates a “longitudinal” analysis — looking at changes in the mutational landscape of a single tumor across multiple time points — as well as a “cross-sectional” analysis using statistical models based on tumors collected from large numbers of patients. For each tumor, if one genetic change is observed before another, a graph connects them with an edge that represents their sequential order. The investigators then consider many sequential networks from different patients to create what they call an Integrated Sequential Network (ISN). The final TEDG can then be inferred from the ISN by removing indirect associations using a technology called network deconvolution (recently developed at the Massachusetts Institute of Technology). The final graph shows the relationships among the different cancer-driving gene mutations, with arrows indicating the order in which they typically arise.

The method developed in the Rabadan lab uses statistical methods to compare changes in the orders of mutations in tumors in multiple patients, producing an Integrated Sequential Network based on all patients. Using network deconvolution, they then generate a tumor evolutionary directed graph that provides a general model for the sequence of mutations.
As a proof of principle, the authors applied their method to chronic lymphocytic leukemia, one of the most common adult cancers. CLL is ideally suited to this type of study because it progresses relatively slowly and blood samples containing leukemic cells can be collected regularly without causing patients any major discomfort. The study used targeted deep sequencing and fluorescence in situ hybridization (FISH) data gathered from 70 CLL patients over a period of 12 years.
When the analysis was complete, the team discovered a consistent pattern in which mutations in CLL follow a branching pattern. Interestingly, the study also showed that each individual case of CLL can follow one of two distinct evolutionary trajectories, indicating that there may be at least two different molecular subtypes of the disease. The authors report that the mutation sequences indicated in the resulting evolutionary graph are consistent with earlier findings, including previous work in the Rabadan Lab that determined that mutations in the gene TP53 are relatively rare early in the course of disease, but multiply in great numbers in patients who develop chemotherapy-resistant CLL.
Dr. Rabadan believes that considering tumor evolution could provide a more effective way of categorizing tumors than cancer genetics approaches that rely on the presence of a single dominant clone. The case of TP53, for example, suggests that rare subpopulations of cells that might be missed in other types of studies could actually constitute better biomarkers for predicting the course an individual tumor might take. Rabadan explains, “The presence of a TP53 mutation indicates a bad prognosis, but by the time it becomes visible in sufficient amounts, it is usually too late to address it effectively. If at the initial time of diagnosis we could accurately predict the evolutionary trajectory that leads to this kind of activity, we might be able to identify other biomarkers that arise earlier and predict that the disease will be resistant to chemotherapy. This would tell you that you need to treat the cancer more aggressively.”
Although the findings in this study are just a beginning in the effort to achieve this kind of application in the clinic, Rabadan points out that they open the door to a new way of analyzing how complex diseases evolve.
— Chris Williams
Related publication
Wang J, Khiabanian H, Rossi D, Fabbri G, Gattei V, Forconi F, Laurenti L, Marasca R, Del Poeta G, Foà R, Pasqualucci L, Gaidano G, Rabadan R. Tumor evolutionary directed graphs and the history of chronic lymphocytic leukemia. Elife. 2014 Dec 11;3.